Block 04 · 04
Evaluating a Company: Quarterly Earnings Reports
A quarterly report is the most reliable gauge of how a company is doing. We break down what to look at and why prices can swing 5–30% within minutes of publication.
Drawing the chart…
Animation starts on scroll
Educational example on illustrative data, not a return forecast
The market compares a company's actual result with what was expected. Let's look at three basic scenarios.
Key takeaway
Important: the market doesn't simply react to a good or bad report. It compares the result with expectations. A company can show profit growth, but if the market expected an even bigger result, the reaction can be negative. Within this interactive we deliberately showed three basic, unambiguous cases so you first understand the fundamental mechanics.
In plain words
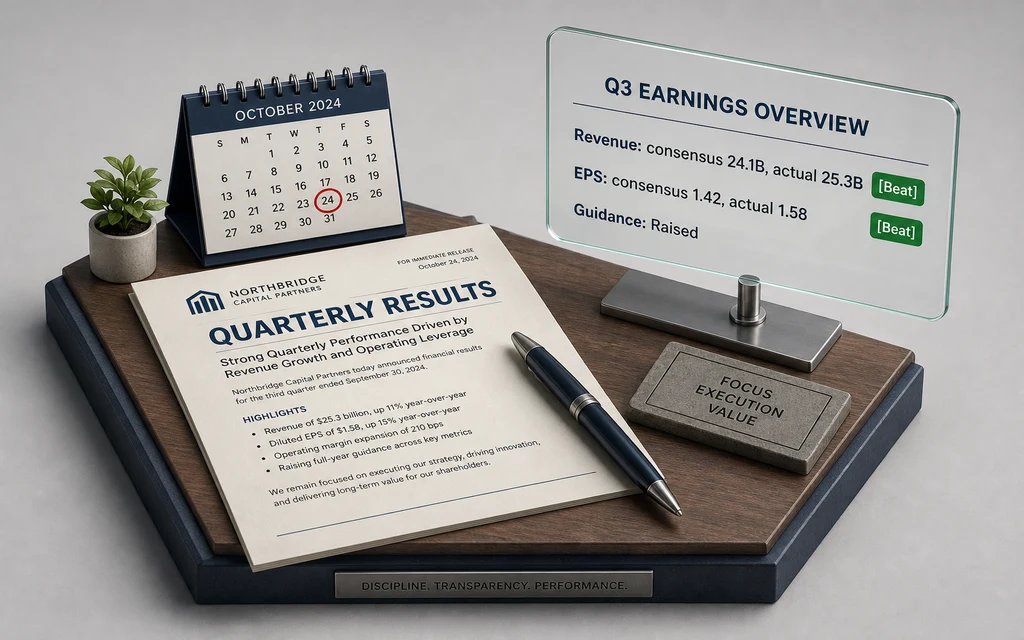
Take a report from a major tech company. The market expected revenue of $89.5 billion and earnings of $1.39 per share — that's the analyst consensus, published in advance. The company reports revenue of $94.9 billion, earnings of $1.64 per share, and guidance for next quarter above current expectations. All three figures came in stronger — and the market re-rates the company upward within the first few minutes after publication. All of this information becomes available at the same instant to a fund managing billions and to an individual investor with a brokerage account. The only difference is who prepared for the date ahead of time.
Every three months, every US public company is required to show everyone its numbers: how much it earned, how much it spent, how much profit is left. That's the , and it comes out on a schedule known ahead of time.
Why it's valuable. You see the real state of the business from an official, audited document, at the same time as every other market participant. There's no inside information here: an institutional fund and an individual investor read the exact same file.
What people look at first. Revenue — how much the company sold. EPS — earnings per share. — the company's forecast for the next quarter. And how these numbers compare to analyst expectations.
How this is used. Report dates are known in advance and published in an earnings calendar. A professional prepares for a strong company's report ahead of time: studying previous quarters, market expectations, and planning a move together with a specialist before the numbers come out.
Try it yourself
The company beat the forecast — what it means for your position
+$0
The stock moves +10.0%. Position $10,000.
Markets trade the deviation from analyst forecasts, not the profit itself. A strong report gaps the stock up, a weak one gaps it down.
Common beginner mistakes
- Looking at absolute numbers without comparing them to consensus
- Ignoring guidance — it's often more important than the current quarter
- Finding out the report date after the fact — the calendar is published in advance
- Judging a single quarter without looking at the trend from prior periods