Block 04 · 06
Crude Oil Inventory Reports: Trading on EIA Data
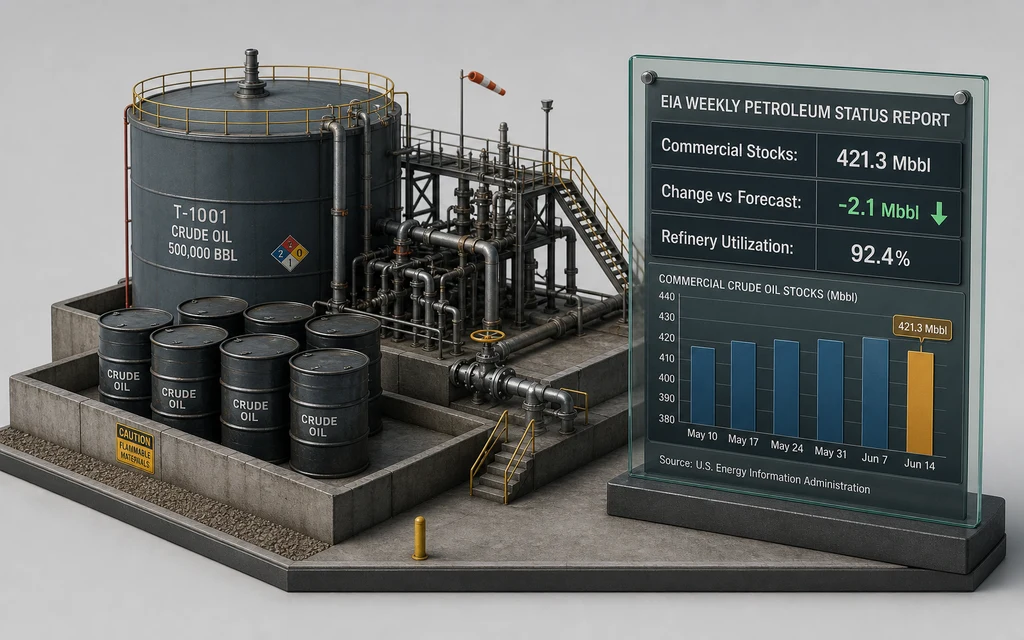
Every Wednesday at 11:30am New York time, the US Energy Information Administration publishes crude oil inventory data. These official figures move oil prices instantly.
Drawing the chart…
Animation starts on scroll
Educational example on illustrative data, not a return forecast
The market reacts not only to the inventory number itself, but to how far the actual result differs from expectations.
- 01
Inventories came in far below expectations
- 02
Supply looks more constrained
- 03
Crude may find support
The scenarios are hypothetical. The direction of price is not guaranteed and this is not investment advice.
In plain words
Take a specific week. Analysts expect a build of 1.5 million barrels. On Wednesday at 10:30am New York time, the EIA publishes its data: inventories fell by 3.2 million barrels, meaning demand pulled significantly more oil than forecast, while refinery utilization rose to 93%. The gap between expectation and reality is nearly 5 million barrels, and WTI crude reflects that with a move within minutes. The event sits on the calendar well ahead of time — both the release time and the forecast are known days in advance. This is data you prepare for, not react to after the fact.
Every Wednesday, the US Energy Information Administration publishes data on how much oil is sitting in American storage. It's official statistics released on a fixed schedule, and it's directly linked to the price of oil.
The logic is simple. If inventories rise, there's more oil on the market than is needed right now. If inventories fall, demand is drawing down supply faster than it's being replenished. Prices react to that difference.
What's actually being watched. The change in commercial crude oil inventories in millions of barrels, gasoline and distillate stocks, , and US production volume. And, most importantly, how much the number differs from analysts' forecasts.
How to use this. The date and time of the release are known in advance: Wednesday, 10:30am New York time. It's one of the few market events you can prepare for down to the minute — study the forecast, review prior weeks, and align your plan with your specialist.
Try it yourself
WTI crude: what a price move gives on the amount in the trade
Risk management — 20% of $50,000 in the trade: $10,000
+$0
The trade holds $10,000, position $50,000 at x5 leverage.
Size first: 20% of capital goes into the trade, leverage scales the position, the rest stays in reserve. EIA inventory reports explain why the price moves in the first place.
Common beginner mistakes
- Looking at the absolute inventory figure instead of the deviation from the forecast
- Ignoring the seasonality of gasoline and distillate demand
- Skipping the preliminary API data released on Tuesday
- Finding out about the release after it happens — the calendar is known a year ahead